Overview
The whyhow user interface is designed to provide a seamless and intuitive experience for creating, managing, and exploring knowledge graphs. The interface is divided into several key areas, each serving a specific purpose:
-
Sidebar: The sidebar is located on the left side of the screen and provides quick access to the main sections of the platform:
- Search: Find anything within your workspace
- Dashboard: Returns you to the main project dashboard.
- Query: Takes you to the querying page.
-
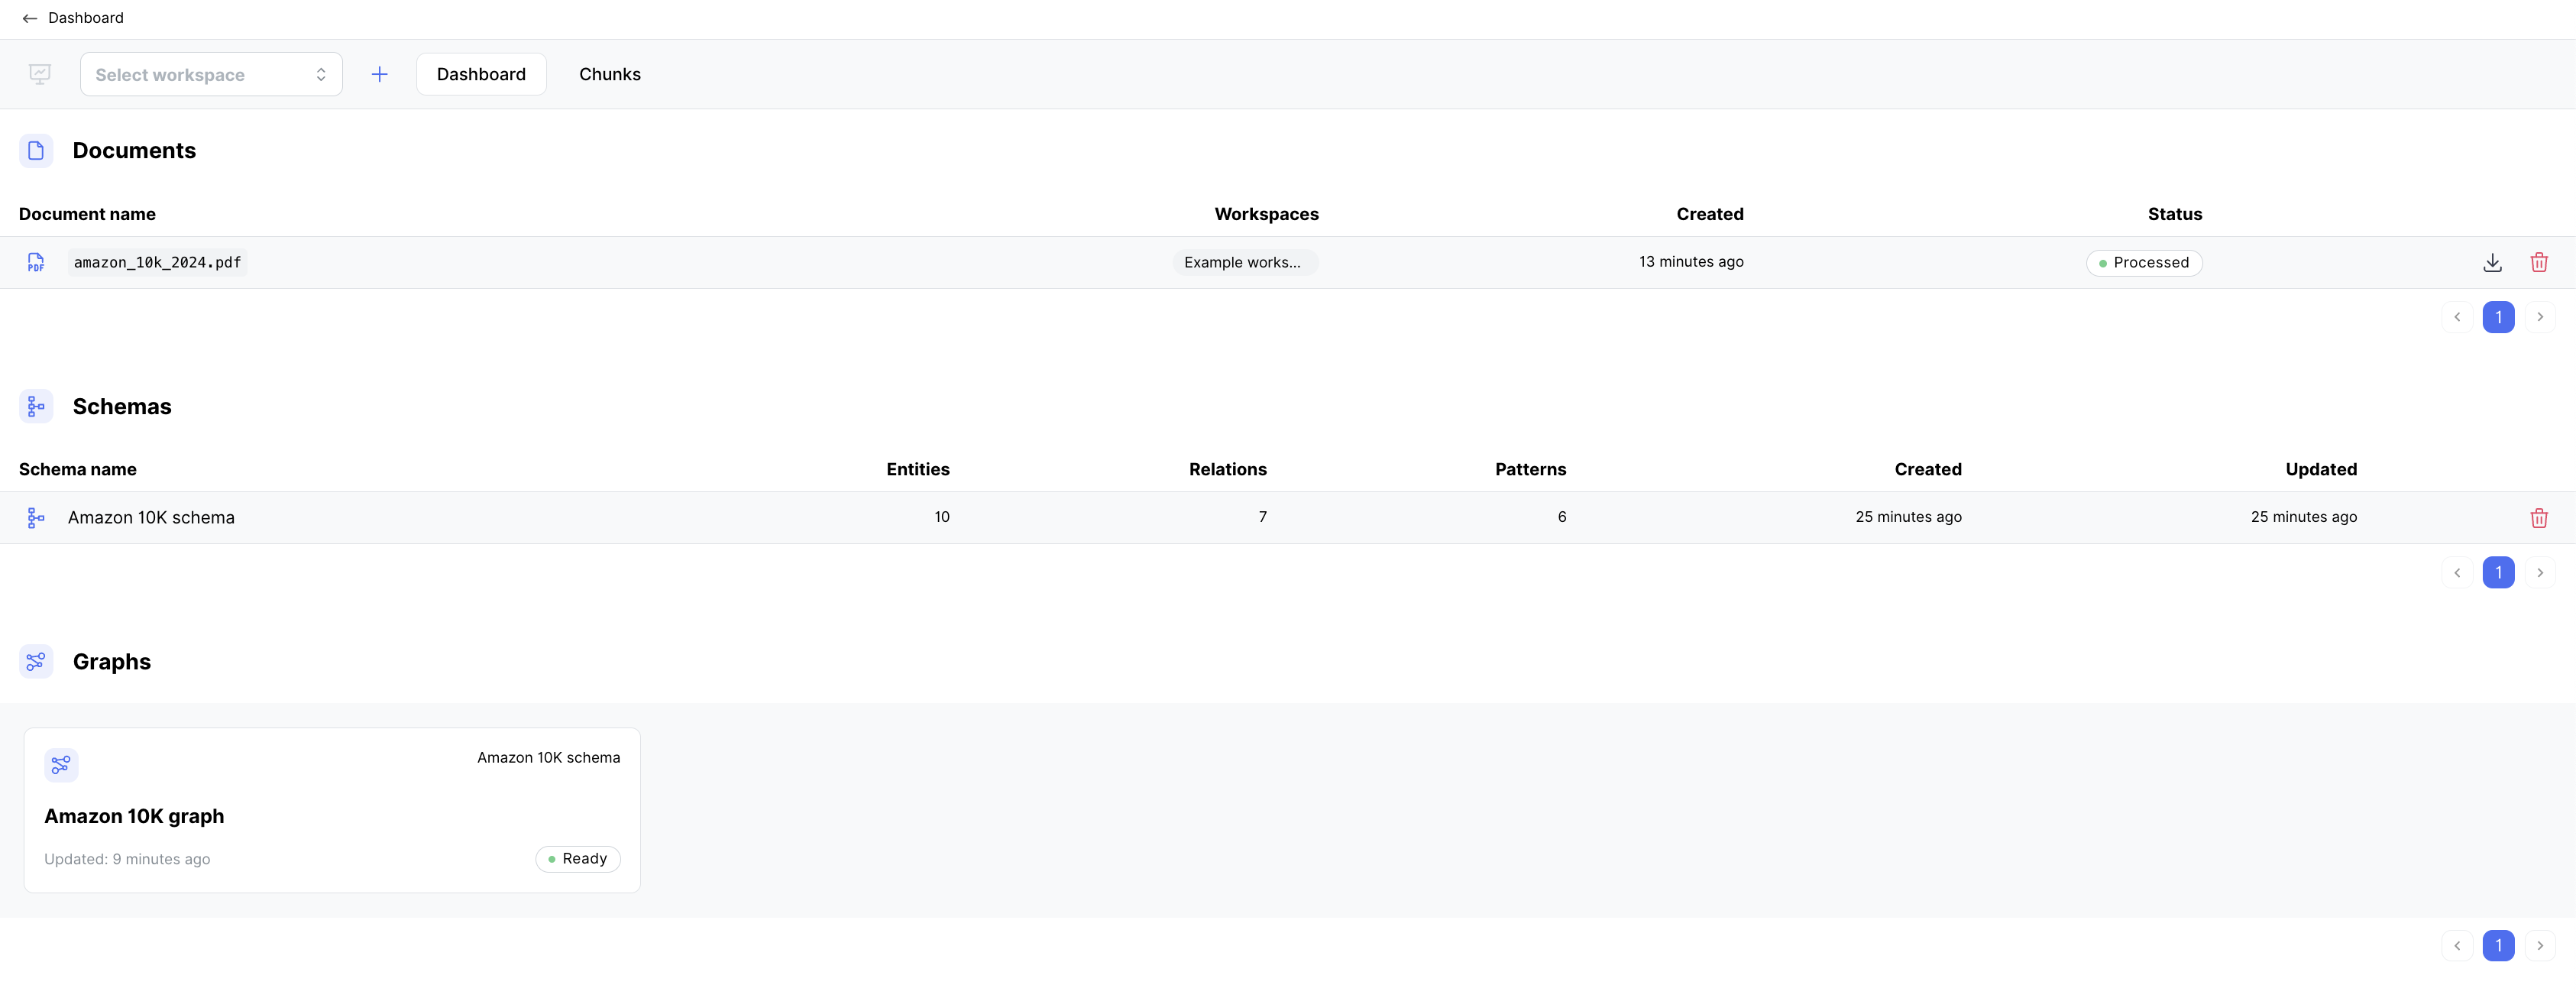
Main Content Area: The central part of the screen is where you interact with your knowledge graphs. Depending on the section you're in, you'll see different views and editors:
- Workspace Overview: Displays a summary of your selected project, including critical metrics and recent activity.
- Graph Visualization: Explore your knowledge graph in an interactive visual format, with options to zoom, pan, and filter.
- Query Builder: Construct complex queries to extract insights from your knowledge graph using a visual query builder.