Components
The whyhow platform provides an intuitive and user-friendly interface for interacting with your knowledge graphs. The main components of the user interface include:
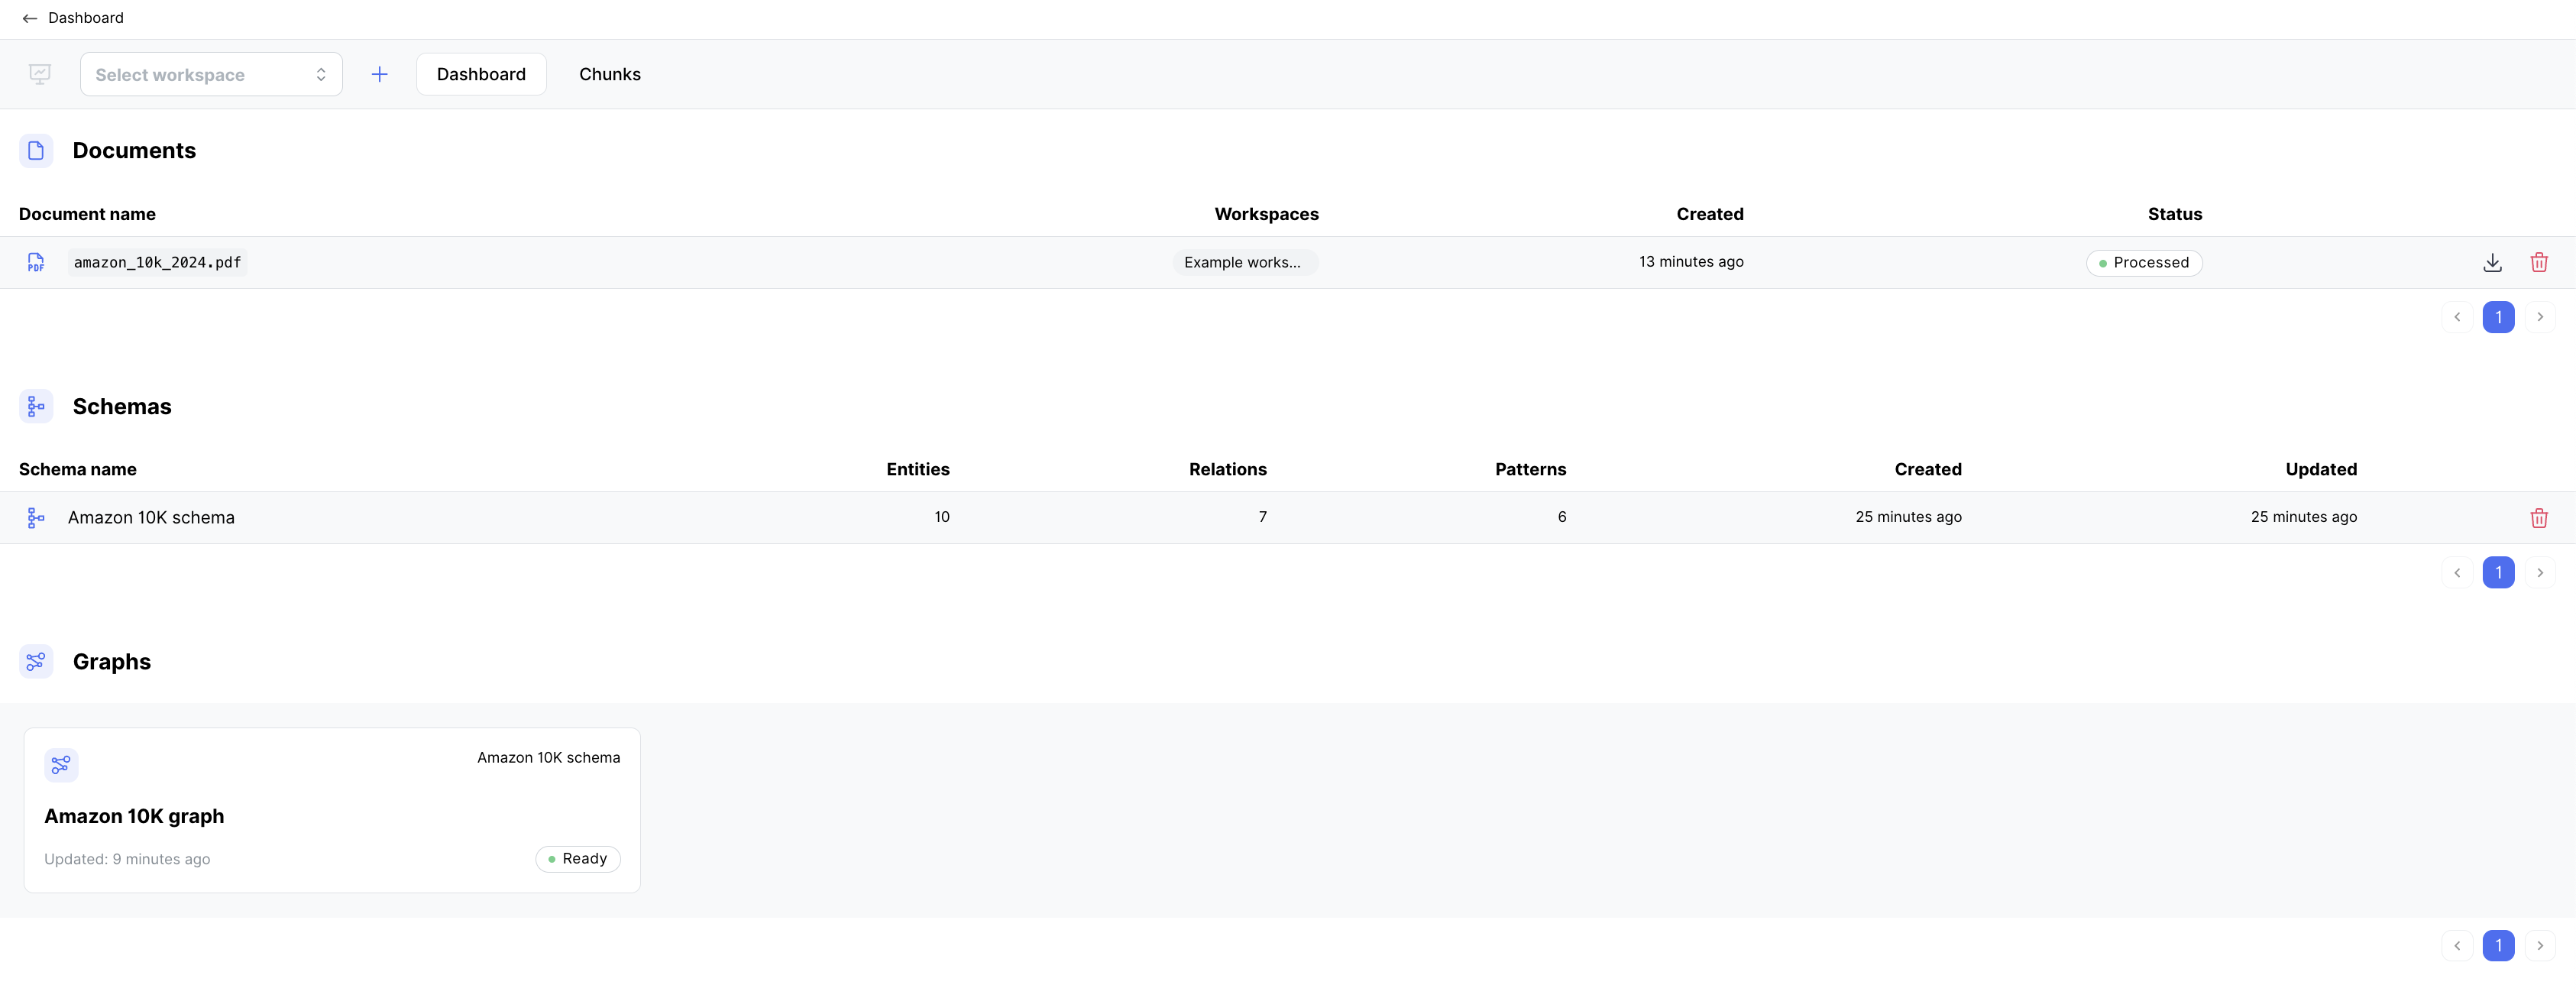
- Workspace Dashboard: This is the central hub for managing knowledge graph projects. You can create new ones, access existing ones, and utilize their progress from here.
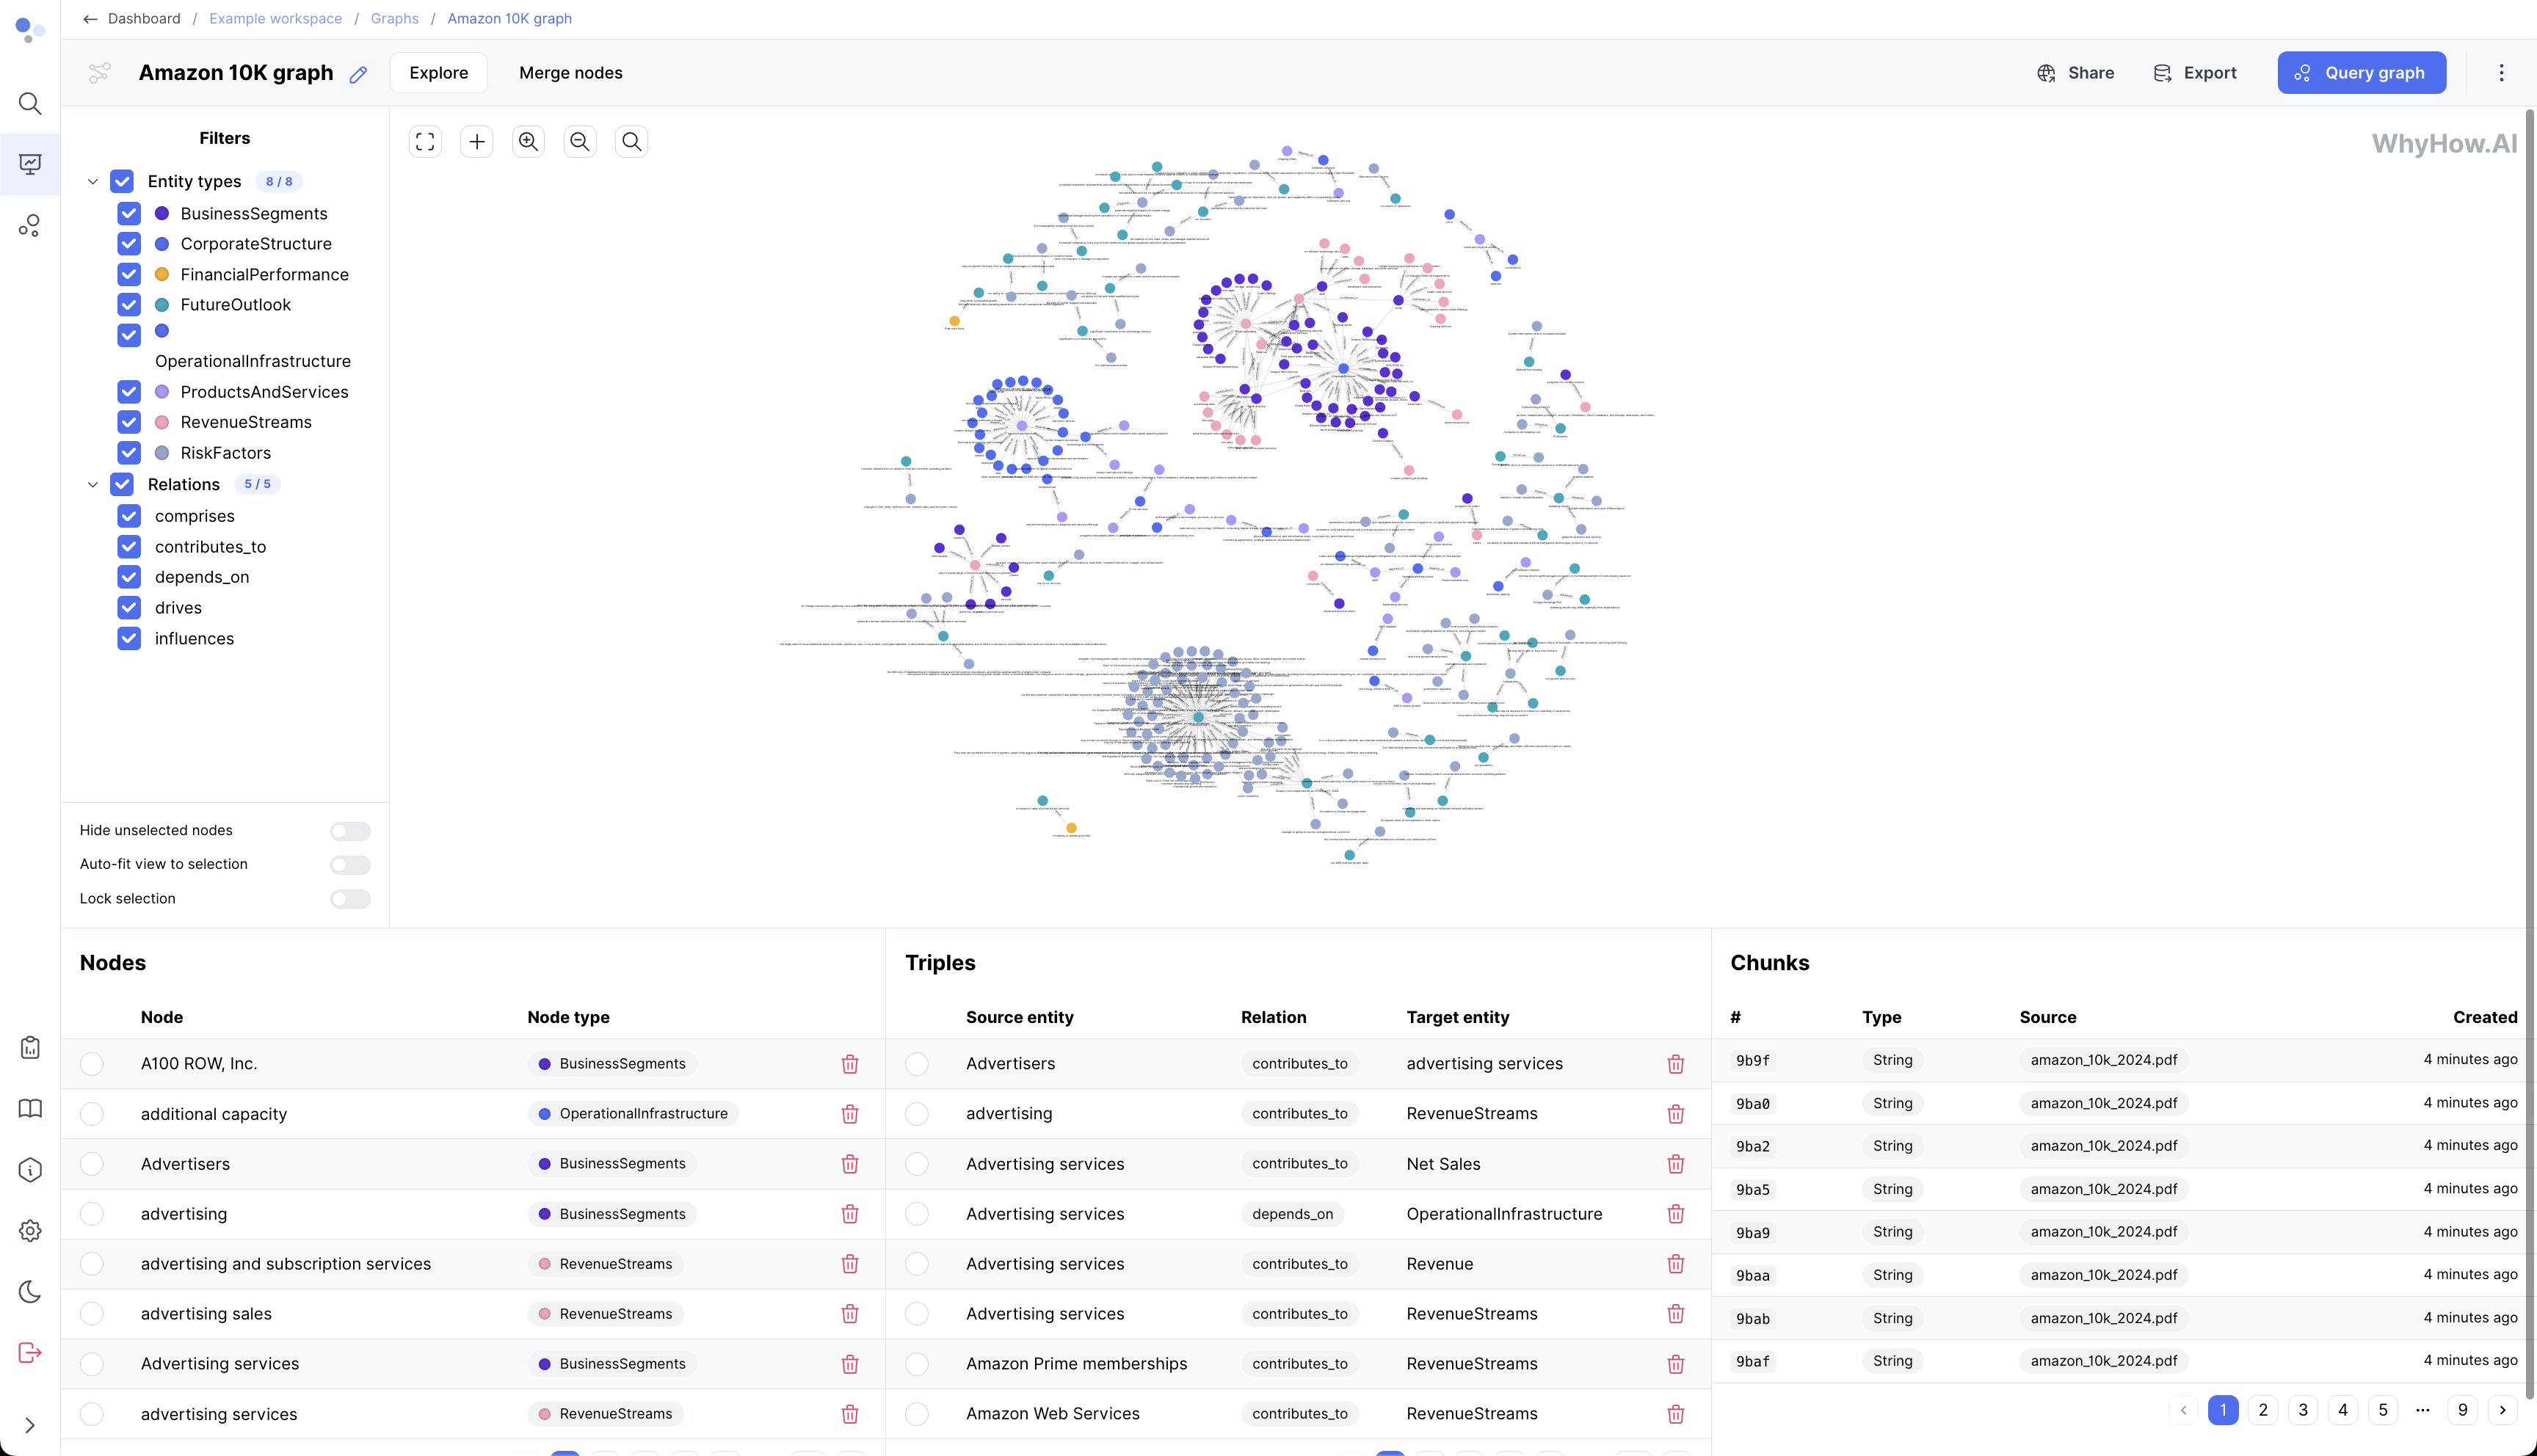
- Graph Visualization: A powerful visualization tool that renders your knowledge graph in an interactive and exploratory format. You can zoom in/out, pan, and click on nodes and edges to view their details.
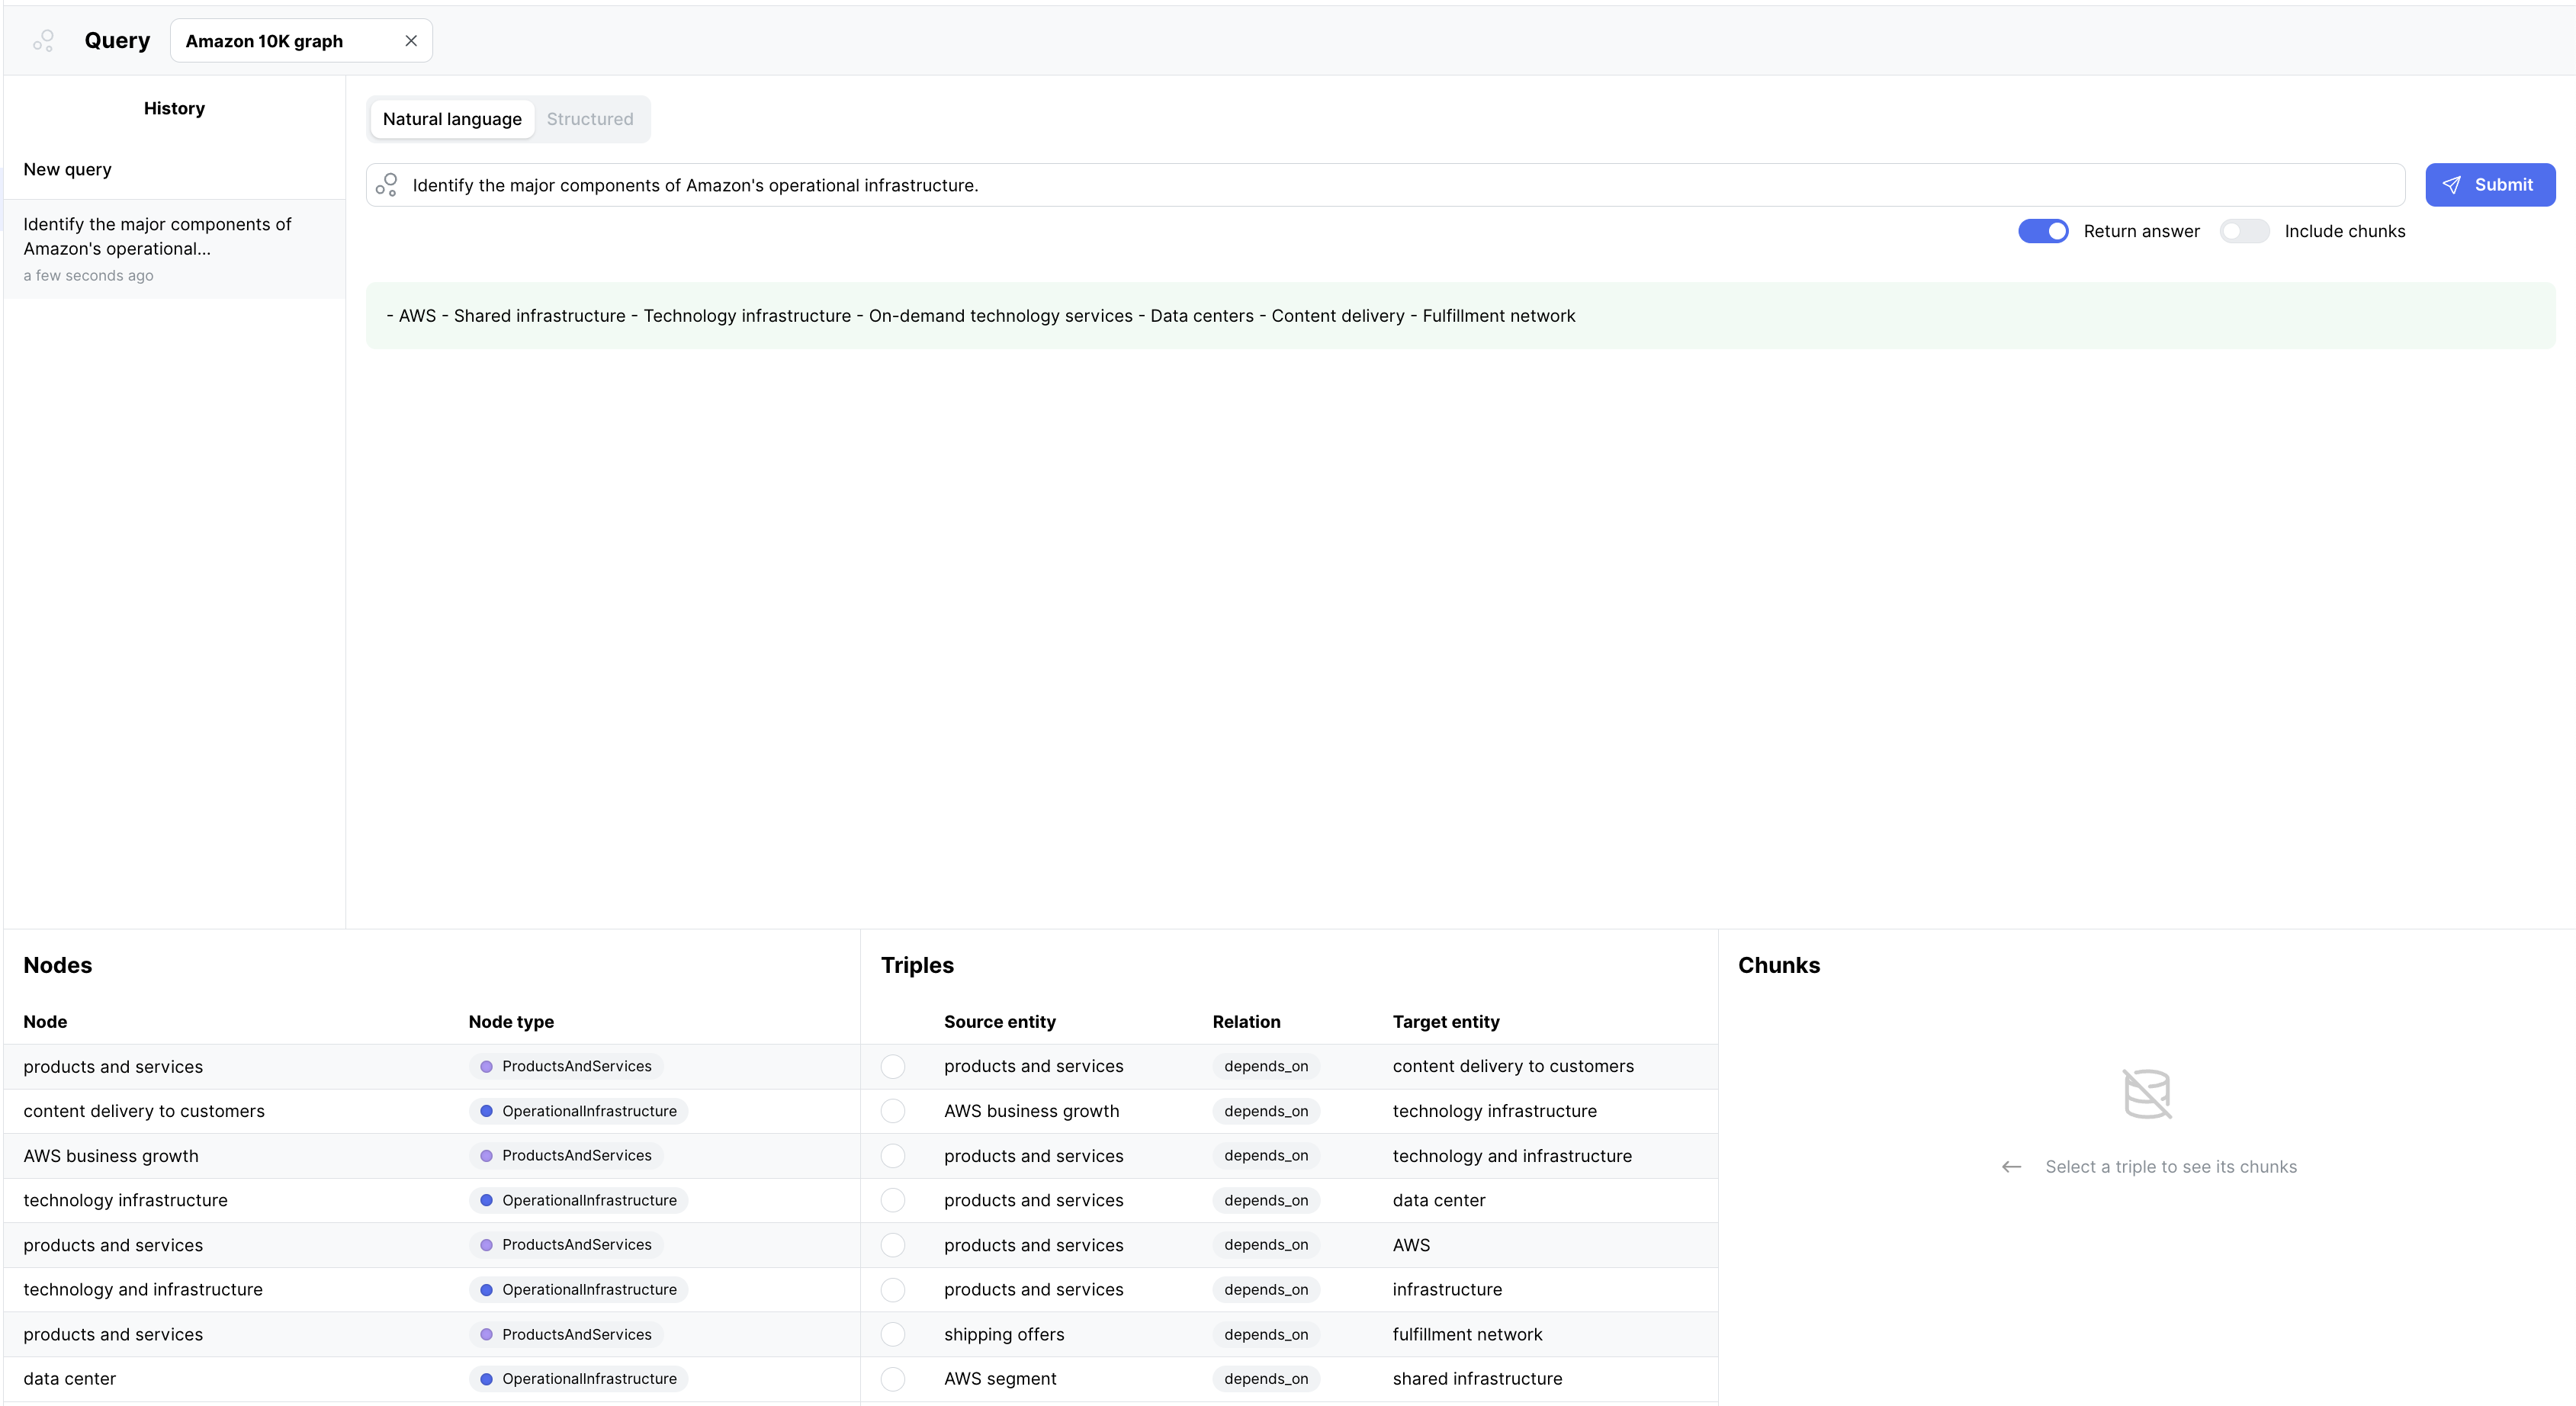
- Query Builder: An intuitive query builder that enables you to construct complex queries to extract insights from your knowledge graph. It supports various query languages and provides a visual interface for building queries.
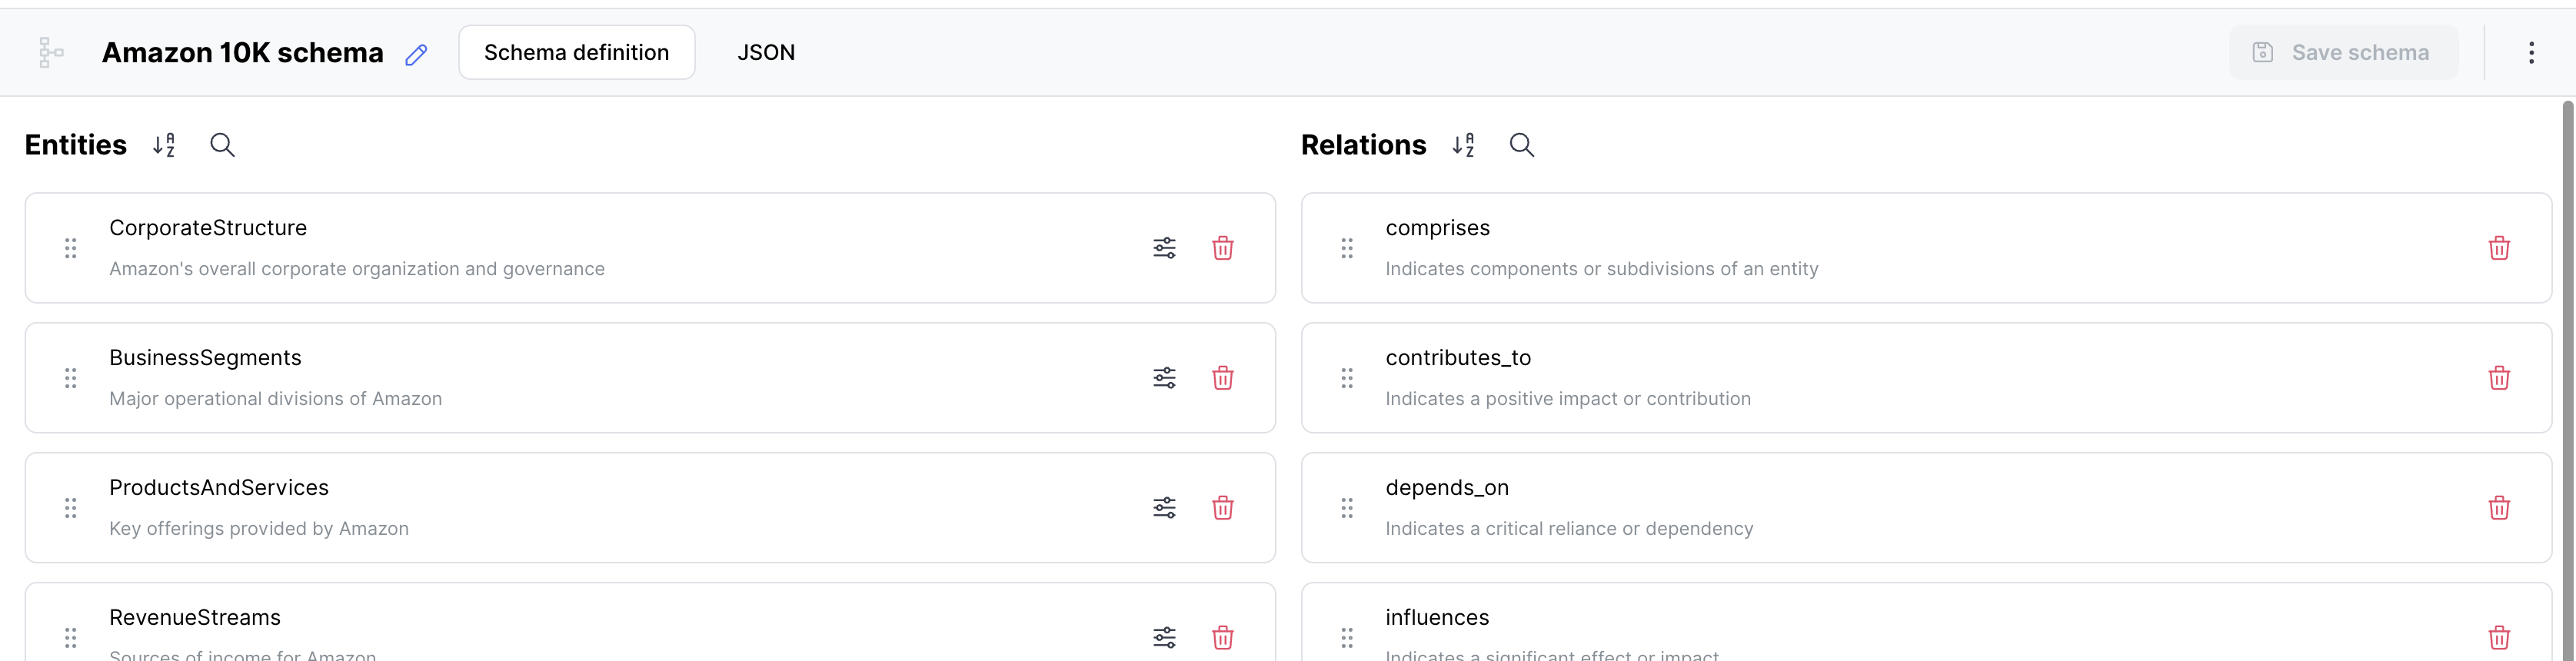
- Schema Manager: A dedicated interface for defining and managing the schema of your knowledge graph. You can create entity types and relationship types and specify their properties and constraints.
These components work seamlessly together to provide a comprehensive and intuitive experience for creating, managing, and exploring your knowledge graphs with whyhow.
For detailed guides on using each component, refer to the following resources: