Welcome to the WhyHow Platform User Guide
This user guide provides comprehensive documentation for the whyhow platform. Whether you're a new user getting started or an experienced user looking for advanced features, this guide will help you navigate and make the most out of the platform.
What is the WhyHow Platform?
This is a powerful platform that enables users to create, manage and query knowledge graphs. The platform allows for document upload, schema management, and graph manipulation, all within a user-friendly no-code interface.
Getting Started
To get started building graphs with WhyHow, install the WhyHow SDK. You can build, manage, and query graphs easily using the SDK (check out our examples) and the platform UI. Create a workspace
We'll start by ceating a workspace. Workspaces are logical ways to separate your graphs. You may want to create separate workspaces for different teams, topics, domains, etc.
workspace = client.workspaces.create(name="Companies")
Upload chunk
Next, we'll upload a chunk that we want to tie to our triple.
Chunks are pieces of structured or unstructured text that are related to the triples you construct. By linking chunks to triples, you can tie your triples to raw text which can be retrieved and referenced when querying and retrieving graph data. This helps you build explainable, evidence-based generative AI solutions.
chunk = client.chunks.create(
    workspace_id=workspace.workspace_id,
    chunks=[Chunk(
        content="preneur and visionary, Sam Altman serves as the CEO of OpenAI, leading advancements in artifici"
    )]
)
Construct triples
Next, we'll create the triples we want to add to our graph. A triple consists of three components: a subject (or a head), a predicate (or a relationship), and an object (or a tail). It represents a statement or a fact about the relationship between two entities. Heads and tails are represented by Nodes, and nodes contain a name as well as a label which describes the type of entity it is. Relations define the nature of the connection between the subject and the object.
Nodes and relations can also contain properties which are metadata about the entity or their relatinship.
# Feel free to extend with your own triples

triples = [
    Triple(
        head=Node(
            name="Sam Altman",
            label="Person",
            properties={"title": "CEO"}
        ),
        relation=Relation(
            name="runs",
        ),
        tail=Node(
            name="OpenAI",
            label="Business",
            properties={"market cap": "$157 Billion"}
        ),
        chunk_ids=[c.chunk_id for c in chunk]
    )
]
We can also add triples to an existing graph.
add_triples = client.graphs.add_triples(
    graph_id=graph.graph_id,
    triples = [
        Triple(
            head=Node(
                name="Matt Garman",
                label="Person",
                properties={"title": "CEO"}
            ),
            relation=Relation(
                name="runs",
            ),
            tail=Node(
                name="Amazon Web Services",
                label="Business",
                properties={"operating income": "$10.4 Billion"}
            )
        )
    ]
)
Create the graph
Now, we can create a graph using the triples we constructed. A graph is simple a collection of triples, made up of nodes and relations.
graph = client.graphs.create_graph_from_triples(
    name="Company Graph",
    workspace_id=workspace.workspace_id,
    triples=triples
)
Query graph
Now that the graph has been constructed, we can ask questions of the graph. We can perform structured queries (where we request the exact entity types, relationship types, and/or node values we want to retrieve), or unstrutured queries (where we ask a natural language question and retrieve the most relevant triples for that question).
query = client.graphs.query_unstructured(
    graph_id=graph.graph_id,
    query="Who runs OpenAI?"
)
Once your graph is built, navigate to the Knowledge Graph Studio Platform UI to find the workspace and graph you created. Select the graph to begin exploring and querying!
Key Concepts
Let's familiarize ourselves with some key concepts used in whyhow:
-
Graph: A knowledge graph is a structured representation of data that consists of nodes (entities) and edges (relationships) between those nodes. It provides a way to model and explore complex domains. Learn more about graphs in the Graph Concept Guide.
-
Triple: A triple is the basic building block of a knowledge graph. It consists of a subject (an entity), a predicate (a relationship), and an object (another entity or a literal value). Triples are used to represent facts or statements in the graph. Refer to the Triple Concept Guide for more details.
-
Node: Nodes represent entities or concepts in the knowledge graph. They can have labels, properties, and relationships with other nodes. Examples of nodes include people, places, organizations, or abstract concepts. Explore the Node Concept Guide for a deeper understanding.
-
Entity: An entity is a real-world object or concept represented as a node in the knowledge graph. Entities have unique identifiers and can have associated properties and relationships. Learn more about entities in the Entity Concept Guide.
-
Workspace: A workspace is a collaborative environment within whyhow where you can create, manage, and share your knowledge graph projects with team members. Workspaces provide a way to organize and control access to your projects. Refer to the Workspace Concept Guide for more information.
-
Chunk: A chunk is a unit of text extracted from your uploaded documents during the graph creation process. Whyhow breaks down your documents into smaller chunks to enable more granular analysis and relationship extraction. Learn more about chunks in the Chunk Concept Guide.
User Interface
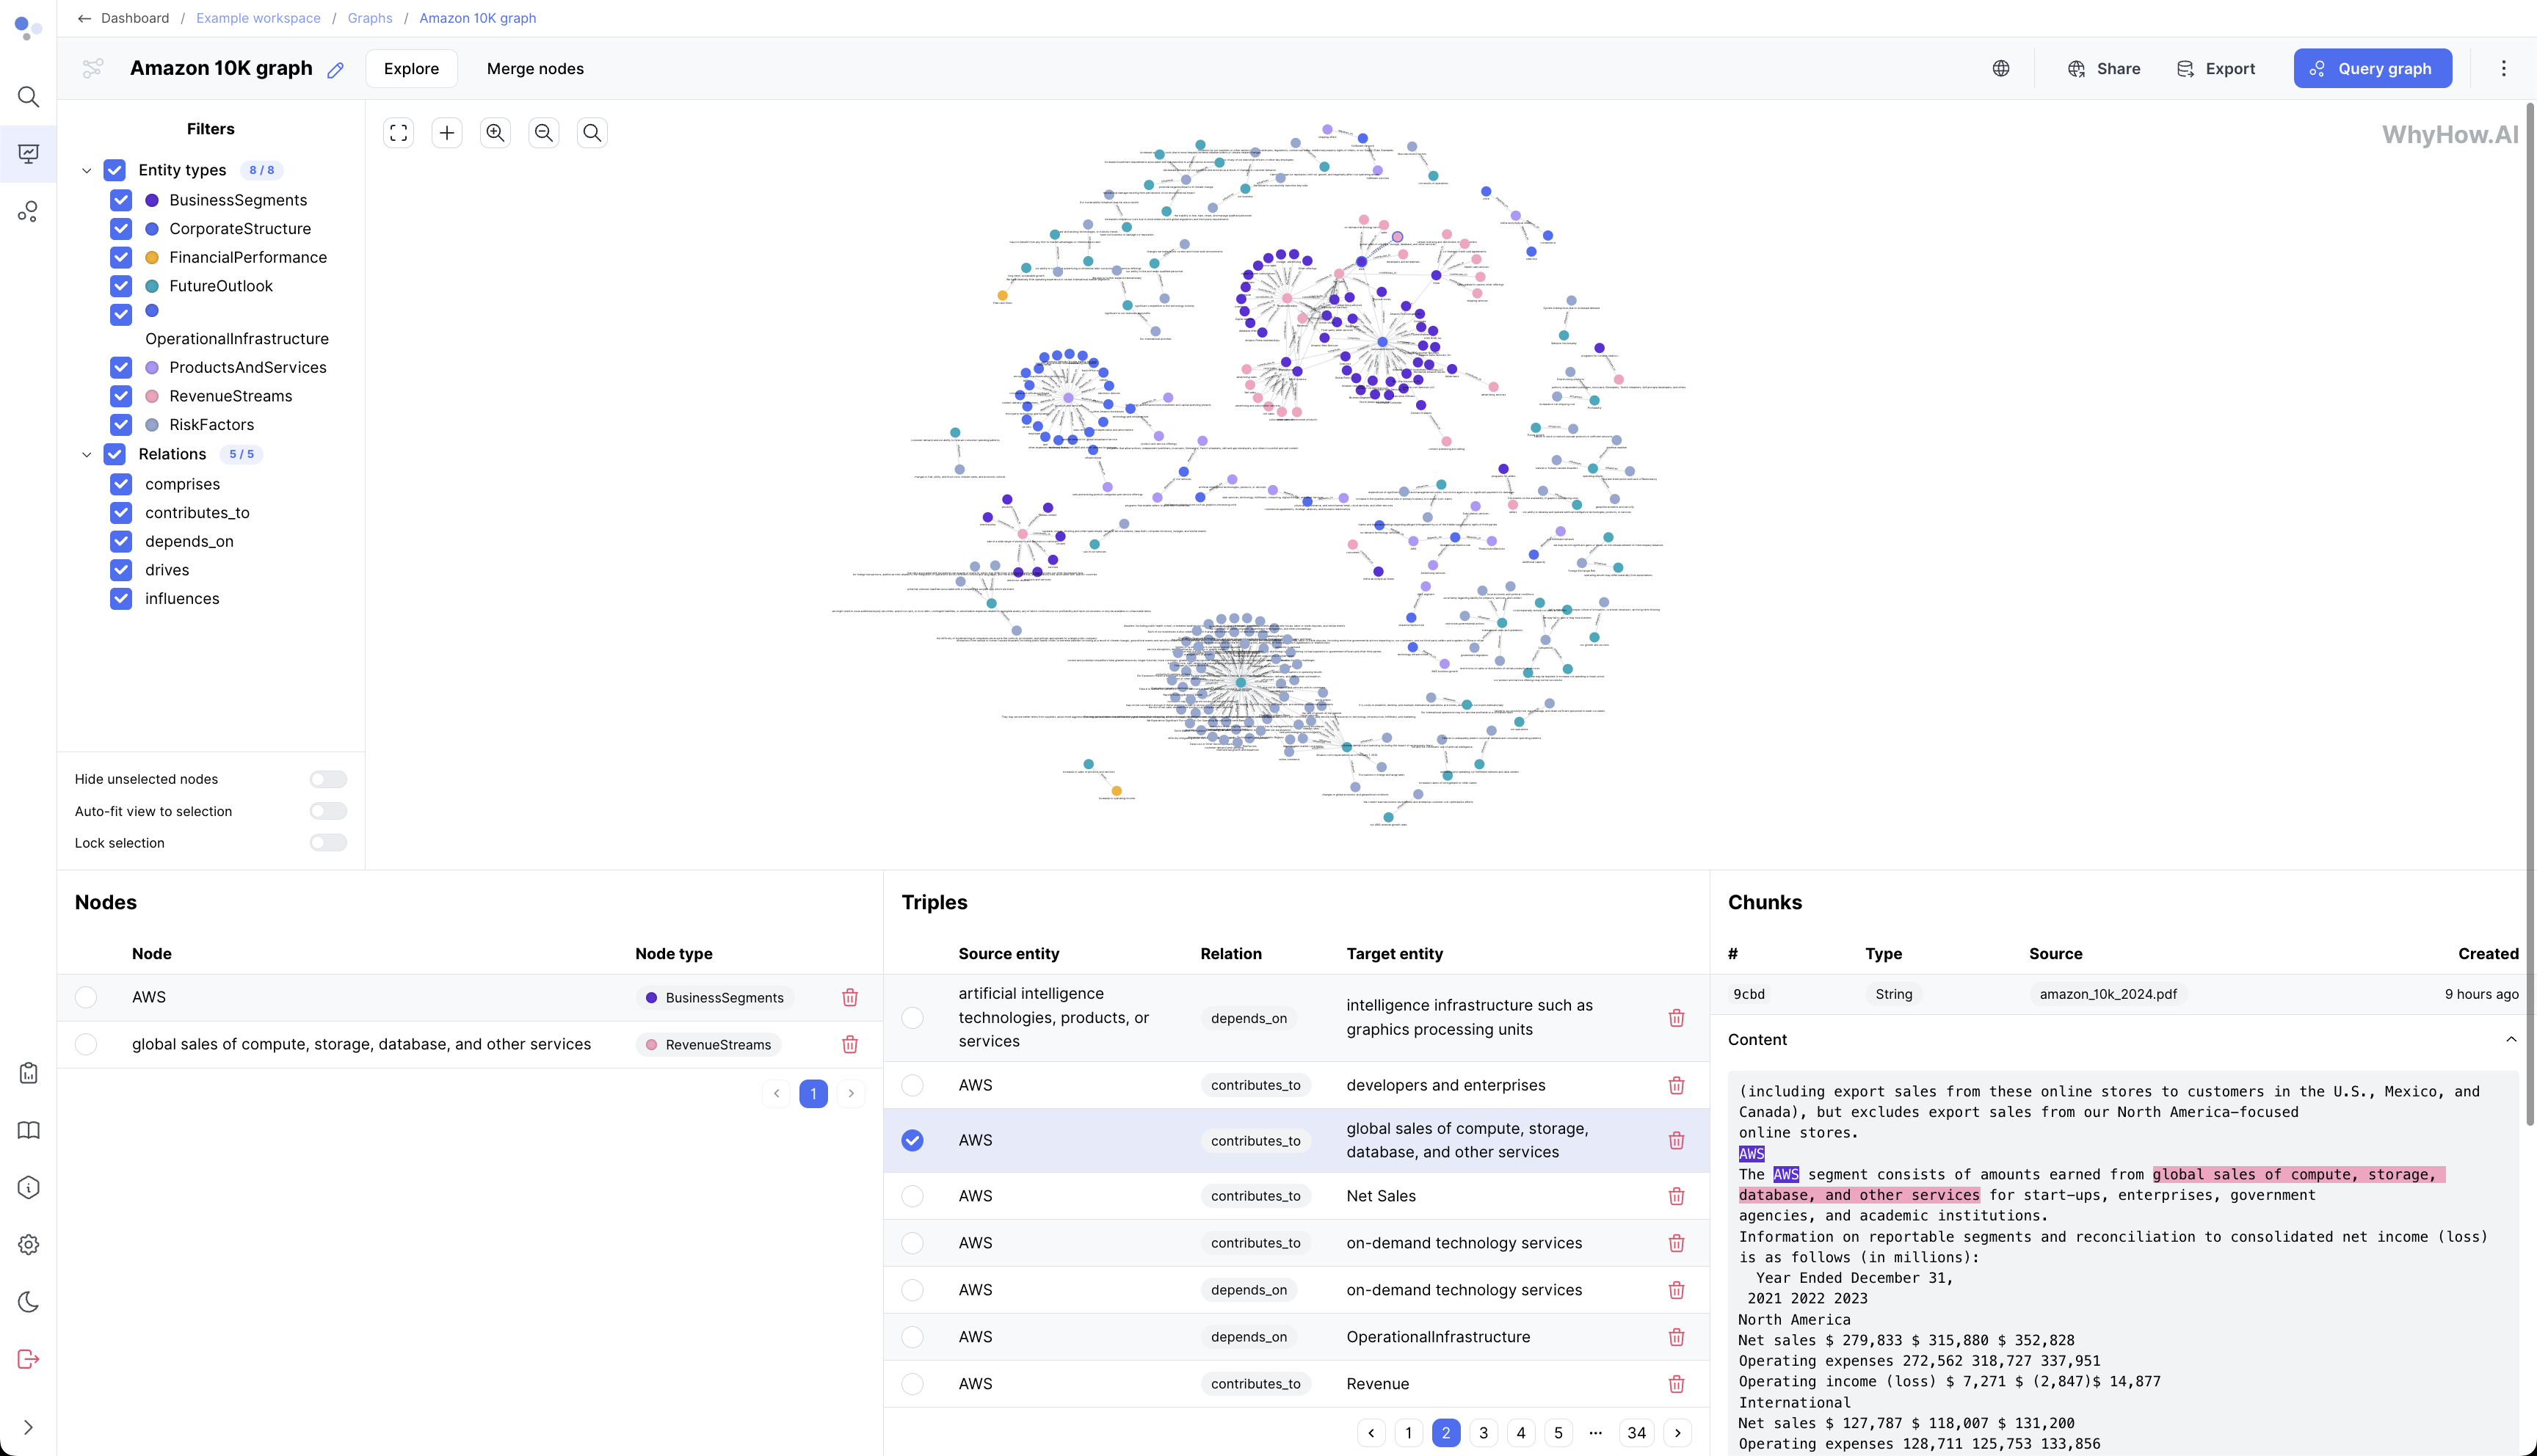
The whyhow platform provides an intuitive user interface for interacting with your data. The main components of the user interface include:
-
Graph Visualization: An interactive visual representation of your knowledge graph. You can zoom in/out, pan, and click on nodes and edges to view their details. Refer to the Graph Visualization Guide for more information on exploring your graph visually.
-
Query Builder: A tool for constructing queries to extract insights from your graph. It supports a variety of query languages and provides a visual interface for building queries. Learn more about querying your graph in the Query Builder Guide.
Limitations and Considerations
While whyhow is a powerful tool, there are a few limitations and considerations to keep in mind:
-
Data Quality: The quality of your knowledge graph depends on the quality and consistency of your input data. Ensure that your data is well-structured, free from errors, and aligned with the defined schema.
-
Schema Design: Creating an effective schema requires careful consideration of your data and use case. Spend time designing a schema that accurately represents your domain and captures the relevant entities and relationships. Explore the Schema Design Guide for tips and guidelines.
-
Scalability: While whyhow can handle large datasets, extremely large graphs may require additional computational resources and optimizations. Be mindful of the size and complexity of your data when working with whyhow.
-
Domain Expertise: Building a knowledge graph requires domain expertise to ensure that the entities, relationships, and schema accurately represent the real-world concepts and interactions. Collaborate with subject matter experts when creating your knowledge graph to ensure its accuracy and relevance.
Troubleshooting and Support
If you encounter any issues or have questions while using whyhow, we're here to help. Our comprehensive troubleshooting guides and support resources will assist you in resolving common problems and getting the most out of the platform.
-
Data Import Issues: If you face challenges during data import, such as file format incompatibility or data quality issues, consult the Data Import Issues Guide for resolution steps.
-
FAQ: Check out our Frequently Asked Questions (FAQ) section for answers to common queries and helpful tips.
If you can't find a solution in our troubleshooting guides or need further assistance, please don't hesitate to reach out to our support team. You can contact us via email: team@whyhow.ai.
Additional Resources
To further enhance your understanding and usage of whyhow, we provide a variety of additional resources:
-
Developer Guide: If you're interested in extending whyhow or integrating it with other systems, check out our Developer Guide for API documentation, SDK tutorials, and customization options.
-
Discord: Join our community of whyhow users and experts on our Discord. Share your experiences, ask questions, and learn from others who are using whyhow for various applications.
Conclusion
We hope this user guide serves as a valuable resource as you embark on your journey with whyhow. By leveraging the power of knowledge graphs and the intuitive features of our platform, you can unlock insights, drive innovation, and make informed decisions.
Remember to refer to the specific guides and resources mentioned throughout this overview for detailed instructions and best practices. If you have any questions or need assistance, our support team is always ready to help.
Thank you for choosing whyhow. We look forward to seeing the knowledge graphs you'll create and the impact they'll have on your organization.